2010
05.16

This post will show you how to generate a list of all the users’ Distinguished Name, then filter it, then do something useful with it.

Scenario: saturday morning (after having crashed into bed at 4:00 a.m., btw), Customer calls. A virus hit the Company and one of the most annoying consequences of the outburst, is that every domain user account gets locked due to brute-force login attempts (as per the “Account Lockout Threshold” policy). While they run around cleaning PCs and fixing A/V installations1, I’m asked for a method to quickly unlock the accounts.

I tend to carry out these kind of tasks “the Unix way”, using the available DOS prompt commands and a bit of VBScript.

  • Start off by calling LDIFDE:
    ldifde -r "(objectclass=user)" -l sAMAccountName -m -f users.ldf

    LDIFDE exports/imports Active Directory data to/from properly formatted (LDIF) text files. I use it a lot. Ran as shown above, LDIFDE exports the objects of class “user” into a file named users.ldf . Of the many attributes an LDAP object bears, I tell LDIFDE to output just the “sAMAccountName” one. If I hadn’t specified any attribute, in the resulting file I’d have found duplicate DNs for the same user. That’s because of how the resulting LDIF file is described. Some A/D data is “incrementally” added to existing objects given their DN. I just picked sAMAccountName because every user has one and, also, to keep the file small.

  • Then:
    findstr /I /b dn.*ou=service.users users.ldf > service_users.txt
    findstr /I /b dn.*cn=users users.ldf > normal_users.txt

    findstr is Microsoft’s “poor man version” of grep, supporting a subset of the regular expression everyone has or should’ve come to love. Here I’m using it to extract Distinguished Names from the LDIF (only the ones that lie in a given Organizational Unit), and saving them to the *_users.txt files. They will look like:

    dn: CN=squidauth,OU=Service Users,DC=contoso,DC=com
    dn: CN=exchangebackup,OU=Service Users,DC=contoso,DC=com
    dn: CN=ldap,OU=Service Users,DC=contoso,DC=com
    dn: CN=batchcopy,OU=Service Users,DC=contoso,DC=com
  • Here’s the VBScript function to unlock an account given its DN:
    Sub unlockuser(userDN)
      Set objUser = GetObject ("LDAP://" & userDN)
      objUser.IsAccountLocked = False
      objUser.SetInfo
    End Sub

    We just need to transform findstr’s output, substituting the leading “dn: ” with “unlockuser” and enclosing in double quotes what follows. At the top of the new, transformed, file, we’ll copy/paste unlockuser subroutine definition. That’ll make our final script.

  • How to carry out the transform? Using this VBS snippet; it processes its Standard Input line by line, and outputs the modifications on Standard Output, just like any Unix file filtering command.
    Set StdIn = WScript.StdIn
    Do While Not StdIn.AtEndOfStream
        line = stdin.readline
        line = right(line,len(line)-4)
        wscript.echo "unlockuser """ & line & """"
    Loop

    I saved it in a “dnfilter.vbs” file and used it this way:

    type service_users.txt | cscript /nologo dnfilter.vbs > unlock_service_users.vbs

    To obtain something like this:

    unlockuser "CN=squidauth,OU=Service Users,DC=contoso,DC=com"
    unlockuser "CN=exchangebackup,OU=Service Users,DC=contoso,DC=com"
    unlockuser "CN=ldap,OU=Service Users,DC=contoso,DC=com"
    unlockuser "CN=batchcopy,OU=Service Users,DC=contoso,DC=com"

As I said, add the unlockuser function at the top of unlock_service_users.vbs and you’ll have your bulk unlocking script.

  1. A/V usefulness is often questionable. At least three times a year an unfortunate Customer gets infected by a 0-day threat… 🙁
2010
05.13

Analysing TCP based protocols often means dealing with TCP sessions (also called streams or flows).
A TCP connection, from an application point of view, is much like a bidirectional file descriptor through which ordered data can be read or written. “On the wire” though, data is not ordered at all. It is split into packets, possibly shuffled and mixed with other traffic. You can capture packets using a sniffer, but to make any sense of them you also need an analyzer tool able to do the reordering/reassembling job. Wireshark, for instance, doubles as a sniffer and an analyzer, backed up by the ubiquitous libpcap.

Imagine having dumped/sniffed 1GB worth of traffic. We would like to pinpoint a single TCP session, isolating it from the rest. Here’s how we could proceed:

  • Identify the source/destination addresses and source/destination ports we’re interested in. Then throw away any packet that doesn’t match this tuple. That’s what Wireshark basically does when you select a packet, right click and hit “Follow TCP Stream”. If the same tuple doesn’t get reused for another, unrelated, session, this method works just fine1.
  • Reorder/reassemble packets.
  • Extract packets’ payload.
  • Present the payload in a way that makes sense. That depends on the L7 protocol. HTTP without keep-alive is strictly request/response: print what the client sent to the server (outbound traffic) before and then what the server answered (inbound traffic). Other protocols may behave differently and you may choose to separate inbound traffic from outbound, or rely on timing to correctly present the dialogue between peers.

Besides Wireshark, there are tools that do just that and can also be automated. See TShark or tcpflow.

What if you want to script everything and build your own TCP analyzer? Perl’s module Net::Analysis is surprisingly convenient for the task. It does the dirty job I described above and presents your code with ready to be processed TCP sessions.

Practical goal: saving MP3 files streamed by Grooveshark. Disclaimer: I’m by no means pushing anyone to illegally download stuff, this is just a working, sensible, instructional example that uses a song freely available anyway (by Revolution Void, check them out here, they’re great).

GroovesharkListener.pm extends Net::Analysis::Listener::HTTP. It sniffs all the traffic from/to port 80 and, as soon as he sees an HTTP response with a content-type of “audio”, dumps its content to file and quits. Simple as that.

Put the module some place where Perl can find it and then launch (as root):

# perl -MNet::Analysis -e main GroovesharkListener 'port 80'
(starting live capture)
/crossdomain.xml
text/xml
/service.php?addSongsToQueueExt
text/html; charset=UTF-8
/static/amazonart/m8c8c9f4291508bca130c1caac2bda75b.png
image/png
[...some more cruft...]
/stream.php
audio/mpeg
Dumping 8481224 bytes to groovesharkgyzBy.mp3 be patient...

# id3v2 -l groovesharkgyzBy.mp3
id3v1 tag info for groovesharkgyzBy.mp3:
Title  : Invisible Walls                 Artist: Revolution Void              
Album  : Increase the Dosage             Year: 2004, Genre: Other (12)
Comment: http://www.jamendo.com/         Track: 1

That’s it, just one more thing. Net::Analysis doesn’t allow you to select a specific network interface, it just picks up the first available one. I wrote a small patch to address this shortcoming, it adds a “device=” parameter that you can use this way:

# perl -MNet::Analysis -e main GroovesharkListener,device=wlan1 'port 80'

And here’s what GroovesharkListener.pm looks like:

# choose a song
# run (as root or via sudo):
#   perl -MNet::Analysis -e main GroovesharkListener 'port 80'
# click "play" and wait for the file to be dumped...
#                             -- Giuliano - http://www.108.bz
package Net::Analysis::Listener::GroovesharkListener;
use strict;
use base qw(Net::Analysis::Listener::HTTP);
use File::Temp;

sub http_transaction {
    my ($self, $args) = @_;
    my ($http_req) = $args->{req};
    my ($http_resp) = $args->{resp};

    print $http_req->uri(), "\n";
    my $content_type = $http_resp->header('Content-Type');
    print "$content_type\n";
    if ($content_type =~ /audio/i) {
        my $fh = new File::Temp(TEMPLATE => 'groovesharkXXXXX',
            SUFFIX   => '.mp3',
            UNLINK   => 0);
        print "Dumping ".length($http_resp->content)." bytes to ".$fh->filename." be patient...\n";
        print $fh $http_resp->content;
        exit;
    }
}

1;
  1. newer Wireshark(s) use the “tcp.stream eq x” primitive
2010
04.28

Active Directory Graphs

Be the first to like.
Share

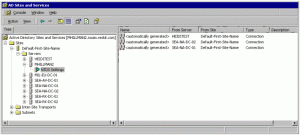
Domain Controllers replicate Active Directory data with each other. They do so through Connections that are partly generated by the KCC (Knowledge Consistency Checker), partly configured by you: the Sysadmin . Each connection is one-way. If you open Active Directory Sites and Services, expand a Site and then a Server node, you’ll notice that Connections listed under NTDS Settings are labeled “From Server” and “From Site”. In the image below (stolen from here), the DC named HEIDITEST will replicate AD changes by sending them to MHILLMAN2. The Connection Object is thus defined from HEIDITEST, to MHILLMAN2. You can expect a specular Connection to exist, defined under the NTDS Settings node of HEIDITEST.

See Active Directory Replication for a more in-depth explanation.
Besides Connection objects automatically created by the KCC, which does its best to build a proper replication topology, you sometimes add your own for fault/link tolerance or other reasons. If the domain is sufficiently big, things may become messy. Instead of fumbling my way through Active Directory Sites and Services I wanted to automatically generate a visual representation of such topology, with DCs and Connections: time to write yet another script.

This time I chose VBS over Perl, hoping that this post would be more “instructional”. Perl on Windows is not so common, while VBScript is the standard way to automate stuff on that O.S. (despite the language being incredibly clumsy and annoying1).

As for the graph format, I chose to output Graphviz DOT format/language.

The script works this way:

  • Find the current domain.
  • Find all the Domain Controllers (AD objects of class nTDSDSA, see this) and the Site they’re in.
  • For each DC/Site, select nTDSConnection objects in NTDS Settings. Of course this is done by means of LDAP queries over ADO, but the view we get is equivalent to what we’re seeing in Active Directory Sites and Services.
  • Print the DOT graph on standard output: DCs, connections and sites. DCs in the same site will be clustered together.

To use it, first generate the graph’s definition:

cscript /nologo ntdsconnections_graph.vbs > AD-pre.dot

Then use Graphviz’s tools to lay out the graph and turn it into an actual image. For optimal results, I suggest something like:

ccomps -x AD-pre.dot | dot | gvpack -u | neato -Tpng -n2 > AD-pre.png

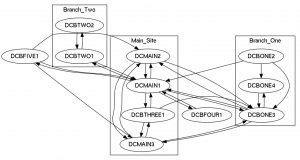
Here’s what showed up, in my test case:

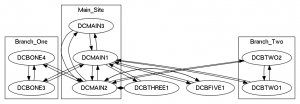
And here’s the same Domain, after some treatment:

Such graphs may be useful from a Sysadmin point of view, but they’re quite ugly, honestly. I originally thought to use Graphviz to output “some” format, read it in Dia or similar diagram drawing software, and then fix the aesthetics. But Dia support (if it ever worked) has been dropped from Grapviz (December 10, 2009). Dia’s 0.97.1 tarball bears a “dot2dia.py” plugin, but I haven’t hacked it into working. Any other editable format known to Graphviz (e.g.: SVG) doesn’t support “connector” primitives meaning that arrows won’t stick to objects while you drag them around… I’ll follow up if I make some progress.

' A/D replication topology graph (Graphviz .DOT format)
' in the current Domain.
' ----------------------------
' Giuliano - http://www.108.bz

Set objRootDSE = GetObject("LDAP://RootDSE")
strConfigurationNC = objRootDSE.Get("configurationNamingContext")

Set adoCommand = CreateObject("ADODB.Command")
Set adoConnection = CreateObject("ADODB.Connection")
adoConnection.Provider = "ADsDSOObject"
adoConnection.Open "Active Directory Provider"
adoCommand.ActiveConnection = adoConnection

strBase = "<LDAP://" & strConfigurationNC & ">"
strFilter = "(objectClass=nTDSDSA)"
strAttributes = "AdsPath"
strQuery = strBase & ";" & strFilter & ";" & strAttributes & ";subtree"

adoCommand.CommandText = strQuery
adoCommand.Properties("Page Size") = 100
adoCommand.Properties("Timeout") = 60
adoCommand.Properties("Cache Results") = False

Set adoRecordset = adoCommand.Execute

Dim dictDCtoSite
Set dictDCtoSite = CreateObject("Scripting.Dictionary")
Dim dictSites
Set dictSites = CreateObject("Scripting.Dictionary")
Dim arrLink()

Function pp(s)
    pp = Replace(right(s,len(s)-3), "-", "_") ' trash the leading "CN="
End Function

Do Until adoRecordset.EOF
    Set objDC = _
        GetObject(GetObject(adoRecordset.Fields("AdsPath").Value).Parent)
    Set objSite = _
        GetObject(GetObject(objDC.Parent).Parent)
    dictDCtoSite.Add objDC.name, objSite.name
    if not dictSites.Exists(objSite.name) Then
        dictSites.Add objSite.name, 1
    End If
    adoRecordset.MoveNext
Loop
adoRecordset.Close

For Each strDcRDN in dictDCtoSite.Keys
    strSiteRDN = dictDCtoSite.Item(strDcRDN)

    strNtdsSettingsPath = "LDAP://cn=NTDS Settings," & strDcRDN & _
    ",cn=Servers," & strSiteRDN & ",cn=Sites," & strConfigurationNC

    Set objNtdsSettings = GetObject(strNtdsSettingsPath)

    objNtdsSettings.Filter = Array("nTDSConnection")

    For Each objConnection In objNtdsSettings
        'WScript.Echo strSiteRDN & " : " & Split(objConnection.fromServer, ",")(1) & " -> " & strDcRDN
        ReDim Preserve arrLink(2,k)
        arrLink(0,k) = strSiteRDN
        arrLink(1,k) = Split(objConnection.fromServer, ",")(1)
        arrLink(2,k) = strDcRDN
        k = k + 1
    Next

    Set strNtdsSettingsPath = Nothing
Next

Dim arrSubgraphs()
Redim arrSubgraphs(dictSites.Count-1)

WScript.Echo "Digraph AD {"
WScript.Echo "  fontname=helvetica;"
WScript.Echo "  node [fontname=helvetica];"
' Same site links
For Each strSiteRDN in dictSites
    nosamesitelinks = True
    headerwritten = False
    For k = 0 To Ubound(arrLink, 2)
        If strSiteRDN = arrLink(0,k) Then
            if dictDCtoSite.Item(arrLink(1,k)) = dictDCtoSite.Item(arrLink(2,k)) Then
                if nosamesitelinks Then
                    nosamesitelinks = False
                    WScript.Echo "    subgraph cluster_" & pp(strSiteRDN) & " {"
                    headerwritten = True
                End If
                WScript.Echo "        " & pp(arrLink(1,k)) & " -> " & pp(arrLink(2,k)) & ";"
            End If
        End If
    Next
    If headerwritten Then
        WScript.Echo "        label= """ & pp(strSiteRDN) & """"
        WScript.Echo "    }"
    End If
Next
Wscript.Echo
' Inter-site links
For k = 0 To Ubound(arrLink, 2)
    if dictDCtoSite.Item(arrLink(1,k)) <> dictDCtoSite.Item(arrLink(2,k)) Then
        WScript.Echo "    " & pp(arrLink(1,k)) & " -> " & pp(arrLink(2,k)) & ";"
    End If
Next
WScript.Echo "}"
  1. No powerful and convenient data types, no free and ready to use debugger, no public CPAN-like module repository, unnecessarily verbose syntax; I may go on for an hour…
2010
04.20

A while ago I was trying to get my head around some nasty network performance issues. A couple of firewalls were in the play, along with a Bandwidth Manager device (an Allot NetEnforcer AC-402).

I wasn’t completely satisfied with NetEnforcer reporting functions and wanted something more dependable and realtime. Well, if you turn to the device’s CLI access (SSH), you’ll notice an interesting acthruput command.
It shows the current throughput per Interface, Line, Pipe and Virtual Channel. What more could you ask for?

AC:~# acthruput
---------------------------------------------------------
Entity         Name                              Bits/sec
---------------------------------------------------------
INTERFACE      Internal                           1918600
  LINE         1                                  1770720
      PIPE     8                                     2144
          VC   32                                    2144
      PIPE     5                                     7136
          VC   8                                     7136
[..]
---------------------------------------------------------
INTERFACE      External                           9509880
  LINE         1                                  9421000
      PIPE     8                                    96960
          VC   32                                   96960
      PIPE     13                                     752
          VC   22                                     752
[..]

As you can see, acthruput identifies Pipes by number. How do you relate this number to the actual mnemonic pipe name? Use “acstat -l pipe“, which also displays the total number of live connections per pipe .

AC:~# acstat -l pipe
---------------------------------------------------------------------------------
Rule QID                Rule name                                Live connections
---------------------------------------------------------------------------------
1.8.0.0.0               Customer1 ; Fallback                     10
1.13.0.0.0              Customer2 ; Fallback                     7
1.5.0.0.0               Customer3 ; Fallback                     23
[..]

Wrap acthruput in a while loop that adds a timestamp and a delay (→ sampling frequency). Start your terminal emulator logging facilities, hit enter, wait, ctrl-c, stop logging.

AC:~# while [ 1 ] ; do date; acthruput; sleep 10; done

Eventually, clean the log a bit and feed it to the Perl script you’ll find at the end of this post.

$ DATE='Thu Dec 10'; grep "$DATE\|INTERFACE\|LINE\|PIPE" "log.txt"  | ./allot_fmt.pl "$DATE" > log.csv

The script outputs CSV formatted data:

timestamp;ifc;L1;P1;P10;P12;P2;P3;P4;P5;P8;P9;
Thu Dec 10 14:48:00 CET 2009;Int;2779648;2599928;4608;;111760;1024;;9792;;52536;
Thu Dec 10 14:48:00 CET 2009;Ext;8372424;5372392;206448;;2407264;60720;;258816;;66784;
Thu Dec 10 14:48:12 CET 2009;Int;1909272;1699872;3776;;170624;512;;1216;;33272;
Thu Dec 10 14:48:12 CET 2009;Ext;7932680;7370584;97152;;350920;36432;;12144;;65448;
[..]

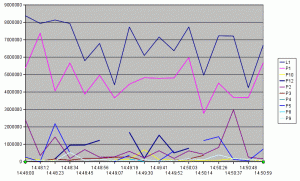
And here’s what it looks like when opened up in OpenOffice Calc (sorry, no fancy formatting).
NetEnforcer bandwidth report
The graph above shows that the 8Mbps link (the “Line”, in Allot’s parlance) is not saturated. Problem was that, during that timeframe, we were also trying to make Iperf “consume” all of the available bandwidth. We couldn’t make it because one of the firewalls was acting as a bottleneck if presented with certain workloads (many connections, see this) . Being able to generate these kinds of report proved very useful in troubleshooting…

#!/usr/bin/perl
# Giuliano - http://www.108.bz
use strict;

my @samples;

my $lastsample;
my $lastint;

while (<STDIN>) {
    s/[\r\n]*//g;
    next unless $_;
    if (/$ARGV[0]/) {
        $lastsample = [];
        $lastsample->[0] = $_;
        $lastsample->[1] = {};
        push @samples, $lastsample;
        #print "$_\n";
    } elsif (/INTERFACE/) {
        s/^.*INTERFACE.*(Int|Ext)ernal.*$/$1/;
        $lastint = $_;
        #print "$lastint\n";
    } elsif (/LINE/) {
        s/^.*LINE\s*([0-9]+)\s*(\d+).*$/L$1;$2/;
        my ($line,$tput) = split ';', $_;
        #print "$line,$tput\n";
        $lastsample->[1]->{$lastint}->{$line} = $tput;
    } elsif (/PIPE/) {
        s/^.*PIPE\s*([0-9]+)\s*(\d+).*$/P$1;$2/;
        my ($pipe,$tput) = split ';', $_;
        #print "$pipe,$tput\n";
        $lastsample->[1]->{$lastint}->{$pipe} = $tput;
    } else {
        print STDERR "wtf\n";
        exit;
    }
}

my $keys = {};
foreach my $sample (@samples) {
    foreach my $int (keys %{$sample->[1]}) {
        foreach my $key (keys %{$sample->[1]->{$int}}) {
            $keys->{$key} = 1;
        }
    }
}

my @keys = sort keys %$keys;

print "timestamp;ifc;";
foreach my $key (@keys) {
    print "$key;";
}
print "\n";
foreach my $sample (@samples) {
    foreach my $int (('Int','Ext')) {
        print "$sample->[0];";
        print "$int;";
        foreach my $key (@keys) {
            print "$sample->[1]->{$int}->{$key};";
        }
        print "\n";
    }
}

exit;
2010
04.13

Conditional address rewriting with Postfix

5 people like this post.
Share

Today I had the need to (automatically) rewrite sender addresses of an email depending on the recipient domain. A way to trick Postfix into applying a sort of “conditional masquerading”. Postfix rewriting tables are just static key → value dictionaries: they’re used to lookup B given A, but there’s no available logic to cope with more complicated patterns.
A little more context to help me explain: I’m talking about a monitoring system. Alert emails are generated by Nagios and handed to a local Postfix on the same server. And here are the rules to implement:

  • A locally generated email whose destination is inside the company, should leave Postfix with a @FQDN suffix (@hostname.localdomain.lan) in its sender addresses. Sender addresses shouldn’t be rewritten/masqueraded at all.
  • A locally generated email whose destination is outside of the company, needs to be masquerated, its sender addresses rewritten as @extdomain.com .

Moreover, but that’s a routing matter rather than a rewriting one:

  • Emails directed to @smsgw.localdomain.lan have to be relayed through a different mail server.

As you can see, the logic is: lookup B (rewritten sender) given A (sender) depending on C (recipient).

I found the right hint deeply buried in Postfix’s mailing list: check out Noel Jones post, kudos to him.

  • First, define a new smtp transport in “master.cf”; just copy/paste the existing one and change the first column to whatever name you like. We are explicitly telling the new transport that it will use its own generic regexp map (the -o command-line option).
    [root@hostname postfix]# cd /etc/postfix
    [root@hostname postfix]# grep '^\(smtp\|toext\).*unix' master.cf
    smtp      unix  -       -       n       -       -       smtp
    toext     unix  -       -       n       -       -       smtp -o smtp_generic_maps=regexp:/etc/postfix/generic_toext
  • We also need to take control over the mail routing mechanism. This is done by enabling transport maps.
    [root@hostname postfix]# grep ^transport main.cf
    transport_maps = regexp:/etc/postfix/transport
  • Transport maps (remember that they’re matched against From addresses) are configured in order to:
    • Route mail that should be delivered locally through the local transport. This will preserve /etc/aliases and .forward behaviour and make everything act like you expect on Unix.
    • Route mail to @smsgw.localdomain.lan, via its dedicated gateway, using the “standard” smtp transport.
    • Route mail to @localdomain.lan, through the main SMTP gateway, using the smtp transport.
    • Route any other message through the main SMTP gateway, but use our custom transport.
    [root@hostname postfix]# tail -4 transport
    /@hostname\.localdomain\.lan$/  local:hostname.localdomain.lan
    /@smsgw\.localdomain\.lan$/     smtp:[smsgw.localdomain.lan]
    /@localdomain\.lan/             smtp:[gateway.localdomain.lan]
    /@.*$/                          toext:[gateway.localdomain.lan]
  • The custom transport’s generic map rewrites recipient adresses, shortening the FQDN by preserving just the domain name, and changing the address part before the @ sign. Hostname is being stripped but I still want to be able to tell, at a glance, from where the message originates. When they leave the mail system, rewritten addresses look like usernamehostname@extdomain.com .
    [root@hostname postfix]# cat generic_toext
    /^(.*)@hostname\.localdomain\.lan$/ $1-hostname@extdomain.com
2010
03.28

Today Internet browsing is particularly slow.
At seemingly random intervals, available bandwith drops down and people get more and more irritable. 🙂

How do you find out why this is happening?

The possible causes boil down to:

  1. Router/Firewall1 is not pleased by “something”. Could be an attack or a bug in the device firmware.
  2. Too many connections. Maybe they’re not passing much traffic, but the internet gateway can’t keep up with their number. I’ve seen firewalls perform very badly in this respect. E.g.: 3 connections trying to download/upload as fast as they can, and a total, aggregate, b/w of 10Mbps. Those 3 plus 3000 “normal” connections and a total b/w of 6Mbps.
  3. A reasonable amount of connections, effectively eating all of the available bandwidth.

I’ll skip case A, for now. 😉
In case B you’ll likely want to know the firewall’s idea of “netstat”, meaning the complete listing of TCP/UDP/other connections. No big deal if the device has got some sort of CLI access: capture its output, import it into a spreadsheet, or use awk/sort/grep2 to build your stats. Usually, computing total number of connections by source IP address and sorting accordingly, is enough to gain some insight about what’s going on.
Case C… For long-running (days) data analysis, you could use a tool like NTOP. But if, like me today, you need to act quickly (perhaps because you know that the issue will disappear soon), iftop can hardly be beaten.
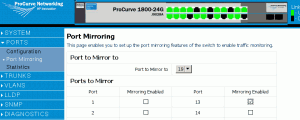
Both tools require the machine they run on to be able to “sniff” all the traffic passing through the firewall. This can be accomplished by configuring monitoring/monitored port(s) on a switch. Monitored ports get their inbound/outbound traffic copied to the monitoring one. Different vendors call the thing a different way, port mirroring is also a good keyphrase. Here are a couple of resources:

(You could as well use a hub instead of a switch and get implicit mirroring of any port, to any port of the hub. Just unplug the firewall, link the hub to the switch, plug firewall and monitoring host in the hub. Kludgy but quick and easy, if you can afford the temporary cabling changes, and the bottleneck introduced by the hub…)

So:

  • Find the switch where the firewall is connected to. Which side of the firewall? It depends on where you believe the issues originates from. Let’s say the culprit is most likely to lie on the LAN → switch port A.
  • Connect your laptop/monitoring machine to the same switch → port B.
  • Set up monitoring: port A is monitored, port B is monitoring.
  • Run iftop, maybe telling it to also show port numbers (“-P”, without this switch, you’ll only see totals by source/destination IP addresses couple), don’t display hostnames “-n”, the interface “-i eth0” and provide a meaningful filter (here I’m selecting packets whose source is not on the LAN3. The “-p” option instructs iftop to capture packets in promiscuous mode. Without it, iftop won’t lift off the wire packets that aren’t addressed to the machine on which it is running.
    iftop -p -P -n -i eth0 -f 'not src net 192.168.200.0/23'

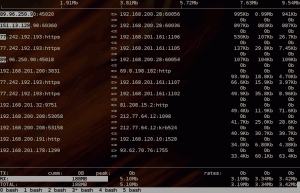
    Iftop will produce a realtime table of running connections, sorted by how demanding they are in terms of bandwidth (10s average, by default). See the screenshot below; the top connections are due to two running video conference streams stealing 1Mbit/second worth of bandwidth, each.

    iftop output

    iftop's output


    Once everything is set up and you’re able to read iftop’s output, spotting the “top talkers” of your net becomes kids play, enjoy!

    1. for brevity, I’ll just say “firewall” from now on.
    2. Yuri is king at doing that. See his AWK weekly series.
    3. iftop will still show these source addresses, since its output is always made of bidirectional “connections”. Only, counters pertaining to the LAN → outside direction, won’t increase.
2010
03.16

What’s the point of having data stored somewhere if you can’t access it and turn it into useful information? Of course the means to do so should be safe, supported, non destructive and flexible if not easy. But usually all you’re left with is some kind of “reporting” feature that necessarily doesn’t do exactly what you need, doesn’t output in a convenient format and so on.

But enough squabbling: in this article I’ll deal with Backup Exec’s internal database.
Here’s what I’m trying to do:

  • Look up all the “Duplicate” Jobs. Show when they started, how long they took to complete, the rate, …
  • For each one of them, try and find the relevant tapes.

I will use the generated report to know which media I should eject out of the library for safe storage. The report will also allow me to quickly and easily update the Excel worksheets where we keep track of how backup’s going.

Our BE database runs on Microsoft SQL Server Express. First thing to do is configure the instance to allow remote TCP/IP connections. Refer to this post, and KB914277.

Then I’m able to point SQL Server Management Studio at it1, and see how the BEDB database is organized.

The view named vwJobHistorySummary is the equivalent of what is seen in BE’s GUI, under Job MonitorJob ListJob History. Easy enough to find out.

What’s not that immediate to guess is how Media IDs relate to Job IDs: skimming through the database tables doesn’t help… How could you reverse engineer BE GUI and discover what SQL queries it’s doing to carry out its job? In fact, there’s a way to “sniff” SQL queries while they’re running:

  • open up BE GUI and select (but don’t open) a completed Job in Job History.
  • run SQL Server Profiler.
  • create a New Trace.
  • Under the Event Selection tab, deselect everything except SQL:BatchStarting. This is not a particularly crowded database, hence no need for filters.
  • Double click on the previously selected Job; SQL Profiler should capture a query similar to:
SELECT * FROM dbo.vwJobHistory WHERE
JobHistoryID='8507cfa9-8417-44ae-88e6-9ac19a0333a9' ORDER BY [JHD.StartTime]
FOR XML AUTO

Looks like Job details are fetched as globs of XML data, perfect to throw our beloved Regular Expressions at.

You can find the script I made at the end of the post. The obligatory notes are:

  • By convention, in our scenario, Policies used to create Duplicate jobs bear a name ending with “-D”. I’m SELECting the last Job IDs with a similar pattern; change it according to your needs, for instance if you’re interested in all the tape directed Jobs (and not just the Duplicate ones).
  • Columns are as follow:
    • Job name. In case you wonder, “FSIWDTH” means: Full Saturday, Incremental Weekdays, Duplicate on Thursday.
    • Actual start timestamp.
    • End timestamp.
    • Elapsed time (seconds).
    • Total bytes written. No bytes written? I skip this Job.
    • Rate (MBytes/minute). Oddly, BE doesn’t seem to always get this value right.
  • The “convert( varchar(” stuff in the main query is needed to fetch dates in a non driver-dependent format (see FreeTDS FAQ).
  • Dates are stored in UTC timezone. I make sure of adding the local TZ offset before printing them out.

Example output:

./be_job_media_report.pl
Sel SERVER03-FSIWDTH-D;20100311 09:15;20100312 11:26;94239;602103130444;405
AK8008L3
AK8011L3
Sel SERVER07-FSIWDTH-D;20100311 09:00;20100311 09:15;921;5133161638;452
AK8011L3
Sel SERVER16-FSIWDWE-D;20100310 10:35;20100310 17:34;25155;5352;0
AK8011L3
Sel SERVER13-FSIWDWE-D;20100310 09:00;20100310 17:29;30572;230425324573;515
AK7140L1
AK8011L3

And the script itself:

#!/usr/bin/perl
# Giuliano - http://www.108.bz
use strict;
use DBI;
use List::Uniq qw(uniq);
use Time::Piece;

sub pretty_time($) {
    my $time;
    $time = Time::Piece->strptime(shift, "%Y-%m-%d %H:%M:%S"); # 2010-03-10 16:34:19
    $time += $time->localtime->tzoffset;
    return $time->strftime('%Y%m%d %H:%M');
}

sub print_last_jobids($$;$) {
    my ($dbh, $number, $jobname_like) = @_;

    my $q = <<EOQ;
SELECT TOP 20 JobHistoryID, JobName,
              convert( varchar(30), OriginalStartTime, 120),
              convert( varchar(30), ActualStartTime, 120),
              convert( varchar(30), EndTime, 120),
              ElapsedTimeSeconds,
              FinalJobStatus, FinalErrorCode, TotalDataSizeBytes, TotalRateMBMin
FROM vwJobHistorySummary
-- WHERE
-- Jobname LIKE '$jobname_like'
ORDER BY ActualStartTime DESC
EOQ

    $q =~ s/-- (WHERE)/$1/ if $jobname_like;
    $q =~ s/-- (Jobname LIKE)/$1/ if $jobname_like;
    my $sth = $dbh->prepare($q);
    $sth->execute();
    my $row;
    while ( $row = $sth->fetchrow_arrayref ) {
        if ($row->[8]) { # TotalDataSizeBytes > 0
            $row->[3] = pretty_time($row->[3]);
            $row->[4] = pretty_time($row->[4]);
            printf "%s;%.f\n", (join ';', @{$row}[1,3,4,5,8]), $row->[9];
        }
        print_media_by_jobhistoryid($dbh, $row->[0]);
    }
}

sub print_media_by_jobhistoryid($$) {
    my ($dbh, $jobid) = @_;

    my $sth = $dbh->prepare(<<EOQ
SELECT * FROM dbo.vwJobHistory where
JobHistoryID='$jobid' ORDER BY [JHD.StartTime]
FOR XML AUTO
EOQ
    );
    $sth->execute();
    my @media;
    my $row;
    while ( $row = $sth->fetchrow_arrayref ) {
        my $record = join ';', @$row;
        push @media, $1 if $record =~ /Data="(.*?)"/;
    }
    print +(join "\n", uniq({sort => 1},@media)), "\n" if @media;
}

### Main

my $dbh = DBI->connect('dbi:Sybase:server=bedbdatasource;database=BEDB','DOMAIN\username','password') or die;
print_last_jobids($dbh, 10, '%-D');

exit;
  1. No need to enable TCP/IP on the instance, if Management Studio is installed on BE server itself
2010
03.01

Counting received emails on MS Exchange

1 person likes this post.
Share

Today I was asked to count the number of emails received on a given address (more than one), across a given time frame. I ended up using Microsoft’s Log Parser (the existence of which I discovered thanks to this post).
Log Parser let’s you run SQL queries on a range of differently formatted log files. Pretty handy stuff: I’ll surely find other uses for it.

MS Exchange, when Message Tracking is enabled, generates a bunch of log files into something like a C:\Exchsrvr\SERVERNAME.log\ folder. The data we need is tracked there.

logparser -q -i:w3c -o:tsv -headers OFF "SELECT DISTINCT MSGID, To_Lowercase(Recipient-Address) As dst FROM C:\Exchsrvr\SERVERNAME.log\*.log WHERE dst = 'addr1@domain.com' OR dst = 'addr2@domain.com'" > x.tsv

“-q” stands for “quiet”, “-i:w3c” states that the input log(s) are in W3C format, “-o:tsv” tells Log Parser to output tab-separated fields, “-headers OFF” is self explanatory and then comes the SQL query. I’m selecting distinct combinations of MSGID and Recipient-Address. Distinct because info about an email message is stored in the log files across multiple lines, keyed by MSGID. A single query is enough to filter all of the addresses we’re interested in, ORed together. Also notice that in the SQL “FROM” clause I used “*.log”; you may need to change that to suit your time frame (message tracking logs are switched daily and stored for a configurable amount of days).

Log Parser’s output, redirected to a file, is then fed to cut/sort/uniq. Remember to change the line termination sequence (“:set fileformat=unix”, on vim) if you don’t have the afore mentioned commands on Windows and move the file to a Unix box.

We use cut (which defaults to tab separated fields) to trash MSGID and just select recipients addresses. These ones get sorted and counted. Last step is a reverse numerical sort. This kind of pipe sequence is a rather common “idiom” on Unix: it computes word (record) frequencies in a file.

cut -f 2 x.tsv | sort | uniq -c | sort -n -r
    782 addr1@domain.com
    747 addr2@domain.com

Phew, no lines of script written for once… 🙂

2010
03.01

Detecting malware using Windows Auditing events

2 people like this post.
Share

This post1 explains how to use nmap and smb-check-vulns to scan a network in search of Conficker infected hosts. I thought that the whole Conficker case was over, but hopefully some of the measures I took to deal with it almost an year ago, will still be relevant to other kinds of malware. And, also, the method I’ll show you here differs from the nmap one in that the latter is active, whereas mine is passive. Actively probing an host for vulnerabilities could be very very much alike “exploiting” it as malware does, and have similar effects. For instance, a service/process could crash, making it not always advisable to run active scans on your servers subnet. Passive analysis, on the other hand, unobtrusively collects clues about who’s misbehaving.

During the Conficker/Downadup outburst, we observed that:

  • Antivirus wasn’t always able to detect/stop it.
  • The virus was copying files in known directories (C:\WINDOWS\SYSTEM32) on about to be infected machines.
  • Security patched hosts were still subject to the remote malicious file copying routine. The copy could either succeed or fail, depending on which permissions had the user that “runs” the virus. The copy in itself doesn’t pose any security concern. Even if no A/V is active on the destination host, but virus exploitable flaws have been patched, malware won’t be able to activate itself. Otherwise, the A/V would remove suspect files as soon as they are caught, without interfering with our detection purposes.

This behaviour makes it possible to use a “honeypot” approach. The detecting server can be any production host provided that it is security patched and A/V protected. You could, as we did, choose a Domain Controller and:

  • Run Administrative ToolsDomain Controller Security Policy
  • Modify the Audit Policy, enabling tracking of successful logon events and object access. By default the OS will only log failures, but that’s not enough.
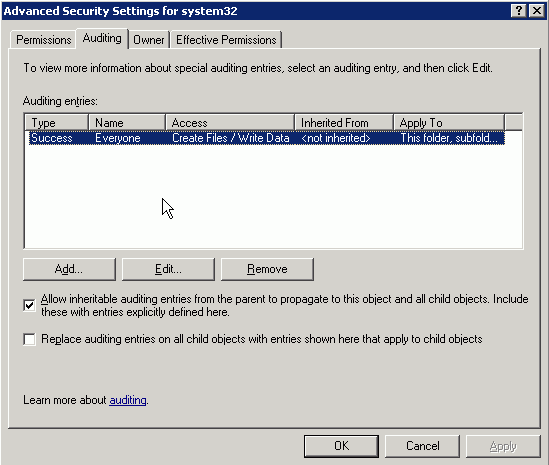
  • Object Access is activated at a file/directory level. Open up the Properties of a directory you know is accessed by the virus, click on Security, then Advanced. The Auditing tab is what you’re interested in. Set things up so that any “Create File/Write Data” attempt of Type “Success” will be logged. The semantics about how auditing settings are propagated from parent to child works in the same way as NFTS permissions.
  • From this point on, you should monitor the honeypot server’s Security Event Log. I wrote a Perl script to do it for me. It works by selecting events with ID 560 and 540, extracting their text and printing just the needed info.

Let’s look at how it’s used (the only parameter is the hostname/address of the honeypot server):

C:\loganalysis>perl ddloganalysis.pl honeypot-srv.domain.lan > ddlog.txt

Skimming through the generated log, you’ll notice the files being dropped into C:\WINDOWS\system32 (or any directory you set up for auditing), the user that actually created them and, before (time-wise), from which address the user is coming.

17/03/2009 16.26.19   560 : C:\WINDOWS\system32\onevthx.vr (Administrator)
17/03/2009 16.26.18   540 :  (10.1.1.94 - Administrator)
17/03/2009 15.35.24   560 : C:\WINDOWS\system32\onevthx.vr (SpectrumLT)
17/03/2009 15.35.24   540 :  (10.6.3.6 - SpectrumLT)

We successfully used the script to pinpoint the rogue hosts. Deeming it useful, here it is:

#!perl

use strict;
use Win32::EventLog;
use POSIX qw ( strftime );

my @matches = (
    #'job$',   # useless, since scheduled tasks are always created by SYSTEM
    'system32',
    'eicar.com'
);

die "Usage:\n$0 servername" unless $ARGV[0];

my $ev=Win32::EventLog->new('Security', $ARGV[0])
    or die "Can't open EventLog\n";
my $recs;
$ev->GetNumber($recs)
    or die "Can't get number of EventLog records\n";
my $base;
$ev->GetOldest($base)
    or die "Can't get number of oldest EventLog record\n";

sub getts($) {
    return strftime '%d/%m/%Y %H.%M.%S', (localtime shift);
}

my @progress = ('-','\','|','/','-','\','|','/');

my $x = $recs-1;
my $h;
while ($x >= 0) {
    $ev->Read(EVENTLOG_FORWARDS_READ|EVENTLOG_SEEK_READ,
        $base + $x,
        $h)
        or die "Can'
t read EventLog entry #$x\n";
    print STDERR $progress[$#progress - ($x % @progress)] . "\r";
    if ($h->{Source} eq 'Security' and ($h->{EventID} == 560 or $h->{EventID} == 540)) {
        Win32::EventLog::GetMessageText($h);
        if ($h->{EventID} == 560) {
            $h->{Message} =~ /Object Name:[\t ]*(.*?)\r/gis;
            my $filename = $1;
            $h->{Message} =~ /Client User Name:[\t ]*(.*?)\r/gis;
            my $clientusername = $1;
            if ($filename) {
                if (grep { my $m = $_; $filename =~ /$m/i} @matches) {
                    printf "%s %5d : %s (%s)\n", getts($h->{TimeGenerated}), $h->{EventID}, $filename, $clientusername;
                }
            }
        } elsif ($h->{EventID} == 540) {
            $h->{Message} =~ /User Name:[\t ]*(.*?)\r/gis;
            my $username = $1;
            $h->{Message} =~ /Workstation Name:[\t ]*(.*?)\r/gis;
            my $workstation = $1;
            $h->{Message} =~ /Source Network Address:[\t ]*(.*?)\r/gis;
            my $addr = $1;
            printf "%s %5d : %s (%s - %s)\n", getts($h->{TimeGenerated}), $h->{EventID}, $workstation, $addr, $username
              if $workstation or $addr;
        }
    }
    $x--;
}

exit;
  1. In italian, sorry. Look here for an english equivalent and here for more info.
2010
02.16

Installing HP Data Protector Disk Agent on Linux

6 people like this post.
Share

The backup server (Cell Manager) runs on Windows, while the client is an x86-64 Red Hat Enterprise Linux 5.3 . Turns out that you’ll need the CD image labeled “Installation Server 2 of 2” – B6960-10020.iso – for HP-UX (?) IA-64 (??). Of course it took me a while to figure it out…

Head towards HP Data Protector v6.0 software depot, press “Receive for Trial”, select the stuff you’d like to download and fill in the form.

First (silly me!), I tried the obvious:

[root@lnxsrv01 ~]# mount -o loop "/mnt/temp/temp/HP Data Protector for Linux x86-64 - Installation Server - 1 of 2 B6960-10011.iso" /mnt/iso1
[root@lnxsrv01 ~]# cd /mnt/iso1/LOCAL_INSTALL/
[root@lnxsrv01 LOCAL_INSTALL]# ./omnisetup.sh -server bcksrv.domain.lan -install da
  No Data Protector/OmniBack software detected on the target system.

  Setup cannot continue, please insert the HP-UX installation CD (CD2)
  and run the installation script again, without options, it will continue.

Ok then, let’s try with the CD it’s suggesting:

[root@lnxsrv01 ~]# umount /mnt/iso1
[root@lnxsrv01 ~]# mount -o loop "/mnt/temp/temp/HP Data Protector for HP-UX IA-64 - Installation Server 2 of 2 B6960-10021.iso" /mnt/iso1
[root@lnxsrv01 ~]# cd /mnt/iso1/LOCAL_INSTALL/
[root@lnxsrv01 LOCAL_INSTALL]# ./omnisetup.sh -server bcksrv.domain.lan -install da

  The omnisetup.sh script didn't finish last time
  Client still has to be installed. (omnicf da)

  The omnisetup.sh script can now continue the unfinished installation
  or it can ignore the saved state and start a new one.
  If you choose to ignore, the script will erase the saved state
  and will process only the command line options
  Do you want to continue the unfinished installation? (Y/n)
 
  Resuming (using possible CLI options)...
 
  No Data Protector/OmniBack software detected on the target system.


  Packets going to be (re)installed: omnicf  da
 
  Unpacking selected packets from CD, please wait (5-10 minutes)...
  Unpacking complete!
 
  Installing Core (omnicf)...

./omni_rinst.sh: line 494: uncompress: command not found
64778 blocks
/
Data Protector Software package successfully installed
  Installing Disk Agent (da)...
    The packet file for this component does not exist
    Either it is not supported on this unix platform
    or some error occurred and the system cannot find
    the file /tmp/omni_tmp/packet.Z or installation
    is not started from appropriate CD
 
  Importing client to bcksrv.domain.lan...
[12:1625] Import host failed.
 
  Current state was saved.  Running the setup again without options
  will make the script to retry the failed operation
  Exiting...

Looks like something’s amiss. It seems that the “uncompress” error (judging on the install script source code) can be safely ignored (the script falls back on using gunzip), while the “Installing Disk Agent” error is bad. Some parts of the software have been installed correctly (telnet on agent’s TCP port 5555 works) but the Client can’t be imported on Cell Manager.

Let’s try with HP-UX CD 1:

[root@lnxsrv01 ~]# umount /mnt/iso1
[root@lnxsrv01 ~]# mount -o loop "/mnt/temp/temp/HP Data Protector for HP-UX IA-64 - Installation Server 1 of 2 B6960-10020.iso" /mnt/iso1/
[root@lnxsrv01 ~]# cd /mnt/iso1/LOCAL_INSTALL/
[root@lnxsrv01 LOCAL_INSTALL]# ./omnisetup.sh -server bcksrv.domain.lan -install da

  The omnisetup.sh script didn't finish last time
  Client still has to be installed. (omnicf da)

  The omnisetup.sh script can now continue the unfinished installation
  or it can ignore the saved state and start a new one.
  If you choose to ignore, the script will erase the saved state
  and will process only the command line options
  Do you want to continue the unfinished installation? (Y/n)

  Resuming (using possible CLI options)...


  Data Protector version A.06.00 found


  Packets going to be (re)installed: omnicf  da

  Unpacking selected packets from CD, please wait (5-10 minutes)...
  Unpacking complete!

  Installing Core (omnicf)...

./omni_rinst.sh: line 494: uncompress: command not found
64778 blocks
/
Data Protector Software package successfully installed
  Installing Disk Agent (da)...

./omni_rinst.sh: line 494: uncompress: command not found
Data Protector Software package successfully installed
  Importing client to bcksrv.domain.lan...
Import host successful.
 
  Installation/Upgrade session finished.

Ok, the Client is indeed visible on Cell Manager.
I guess that the three steps process I went through by “subsequent approximation” isn’t really necessary. You could have just as much luck by downloading B6960-10020.iso and running the installer…