04.20
A while ago I was trying to get my head around some nasty network performance issues. A couple of firewalls were in the play, along with a Bandwidth Manager device (an Allot NetEnforcer AC-402).
I wasn’t completely satisfied with NetEnforcer reporting functions and wanted something more dependable and realtime. Well, if you turn to the device’s CLI access (SSH), you’ll notice an interesting acthruput command.
It shows the current throughput per Interface, Line, Pipe and Virtual Channel. What more could you ask for?
---------------------------------------------------------
Entity Name Bits/sec
---------------------------------------------------------
INTERFACE Internal 1918600
LINE 1 1770720
PIPE 8 2144
VC 32 2144
PIPE 5 7136
VC 8 7136
[..]
---------------------------------------------------------
INTERFACE External 9509880
LINE 1 9421000
PIPE 8 96960
VC 32 96960
PIPE 13 752
VC 22 752
[..]
As you can see, acthruput identifies Pipes by number. How do you relate this number to the actual mnemonic pipe name? Use “acstat -l pipe“, which also displays the total number of live connections per pipe .
---------------------------------------------------------------------------------
Rule QID Rule name Live connections
---------------------------------------------------------------------------------
1.8.0.0.0 Customer1 ; Fallback 10
1.13.0.0.0 Customer2 ; Fallback 7
1.5.0.0.0 Customer3 ; Fallback 23
[..]
Wrap acthruput in a while loop that adds a timestamp and a delay (→ sampling frequency). Start your terminal emulator logging facilities, hit enter, wait, ctrl-c, stop logging.
Eventually, clean the log a bit and feed it to the Perl script you’ll find at the end of this post.
The script outputs CSV formatted data:
Thu Dec 10 14:48:00 CET 2009;Int;2779648;2599928;4608;;111760;1024;;9792;;52536;
Thu Dec 10 14:48:00 CET 2009;Ext;8372424;5372392;206448;;2407264;60720;;258816;;66784;
Thu Dec 10 14:48:12 CET 2009;Int;1909272;1699872;3776;;170624;512;;1216;;33272;
Thu Dec 10 14:48:12 CET 2009;Ext;7932680;7370584;97152;;350920;36432;;12144;;65448;
[..]
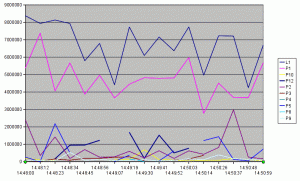
And here’s what it looks like when opened up in OpenOffice Calc (sorry, no fancy formatting).

The graph above shows that the 8Mbps link (the “Line”, in Allot’s parlance) is not saturated. Problem was that, during that timeframe, we were also trying to make Iperf “consume” all of the available bandwidth. We couldn’t make it because one of the firewalls was acting as a bottleneck if presented with certain workloads (many connections, see this) . Being able to generate these kinds of report proved very useful in troubleshooting…
# Giuliano - http://www.108.bz
use strict;
my @samples;
my $lastsample;
my $lastint;
while (<STDIN>) {
s/[\r\n]*//g;
next unless $_;
if (/$ARGV[0]/) {
$lastsample = [];
$lastsample->[0] = $_;
$lastsample->[1] = {};
push @samples, $lastsample;
#print "$_\n";
} elsif (/INTERFACE/) {
s/^.*INTERFACE.*(Int|Ext)ernal.*$/$1/;
$lastint = $_;
#print "$lastint\n";
} elsif (/LINE/) {
s/^.*LINE\s*([0-9]+)\s*(\d+).*$/L$1;$2/;
my ($line,$tput) = split ';', $_;
#print "$line,$tput\n";
$lastsample->[1]->{$lastint}->{$line} = $tput;
} elsif (/PIPE/) {
s/^.*PIPE\s*([0-9]+)\s*(\d+).*$/P$1;$2/;
my ($pipe,$tput) = split ';', $_;
#print "$pipe,$tput\n";
$lastsample->[1]->{$lastint}->{$pipe} = $tput;
} else {
print STDERR "wtf\n";
exit;
}
}
my $keys = {};
foreach my $sample (@samples) {
foreach my $int (keys %{$sample->[1]}) {
foreach my $key (keys %{$sample->[1]->{$int}}) {
$keys->{$key} = 1;
}
}
}
my @keys = sort keys %$keys;
print "timestamp;ifc;";
foreach my $key (@keys) {
print "$key;";
}
print "\n";
foreach my $sample (@samples) {
foreach my $int (('Int','Ext')) {
print "$sample->[0];";
print "$int;";
foreach my $key (@keys) {
print "$sample->[1]->{$int}->{$key};";
}
print "\n";
}
}
exit;


